
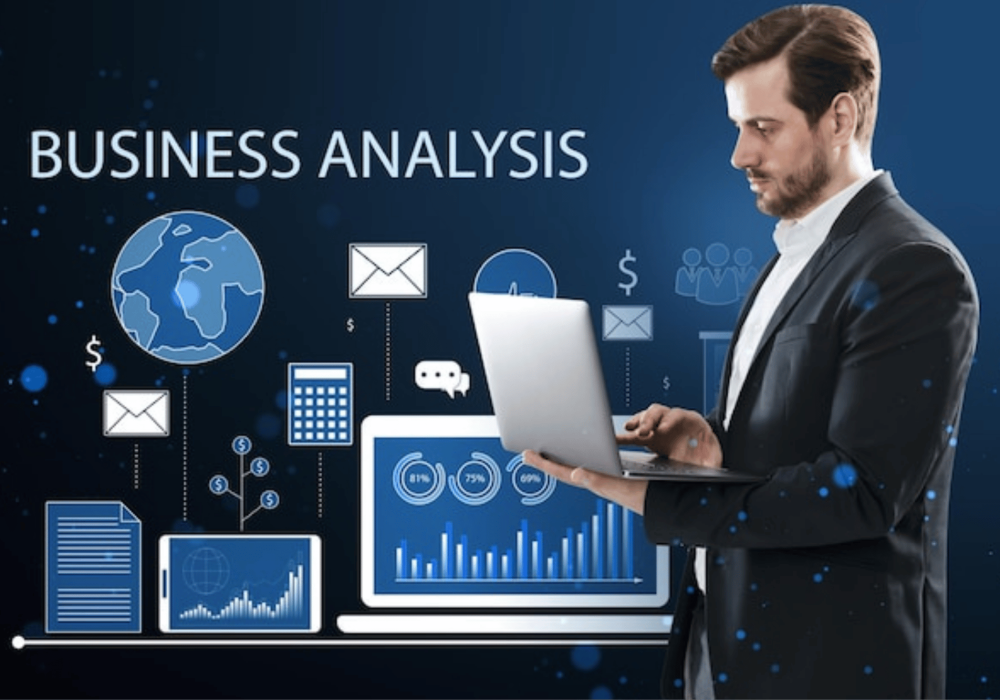
In today’s digital economy, data is the backbone of every successful business. Join the Business Analytics & Visualization Training in Lahore by Digital Marketing Training, Pakistan’s most trusted digital skills institute with 18+ years of industry excellence. This course is designed for professionals, students, entrepreneurs, and freelancers who want to transform raw data into meaningful insights and create powerful visualizations that drive smarter decisions.
With years of experience in digital marketing, eCommerce, and analytics, Digital Marketing Training equips learners with practical knowledge, not just theory. Our program combines business intelligence, data analysis, and visualization tools to help you understand business trends, measure performance, and communicate insights effectively.
Led by Abdul Wahab Ahmad, an expert in data-driven marketing and business growth strategies, this course ensures you gain the real-world skills that businesses need today.
✔ Fundamentals of Data Analytics — Understanding data types, sources, and business applications
✔ Excel & Google Sheets — Data cleaning, formulas, pivot tables, and dashboards
✔ Data Visualization Tools — Hands-on training in Power BI, Tableau, and Google Data Studio
✔ Business Reporting — Building interactive dashboards for KPIs and metrics
✔ Predictive Analytics — Using data models for future forecasting
✔ Real-World Applications — Case studies from marketing, eCommerce, and finance
✅ Practical Hands-on Training with industry-leading tools
✅ Interactive Dashboards — Build your own live reports and analytics boards
✅ Case Studies from real businesses to understand how analytics solves challenges
✅ Freelancing & Career Guidance — Learn how to monetize your analytics skills
✅ Certification to showcase your expertise in the job market
Learn Business Analytics in detail. It is a web analytics service offered by Google that tracks website traffic for marketing purposes.
Learn how to make use of reports in Conversions section including Goals, E-commerce, Multi Channel Funnels and other reports.
Learn how data updates continuously and each page view is reported seconds after it occurs.
Learn how to make use of reports in Audience section including Demogrphics, Behaviour, Technology, Benchmarking and other reports.
Learn how to make use of reports in Acquisition section including All Traffic, Google Ads, Search Console and other reports.
Learn how to make use of reports in Behaviour section including Site Content, Site Speed, Site Search, Events and other reports.
Our training course ensures that the trainee should be equipped with the latest techniques to secure the results.
Understanding HyperLaunch, Dos and Donts of a Launch.
This course educates and ensures to defining and achieving the realistic goals of your campaign.
In today’s digital economy, data is the new fuel for business success. This course teaches you how to collect, analyze, and interpret data effectively. From understanding business KPIs to identifying patterns and trends, you’ll learn how to turn raw numbers into actionable insights. These skills empower you to make smarter decisions, optimize strategies, and create measurable impact in marketing, sales, operations, and overall business performance.
Business analytics is about more than theory—it’s about applying knowledge using powerful tools. In this course, you’ll gain practical experience with platforms like Power BI, Google Data Studio, and Excel. You’ll learn to build dashboards, create stunning visualizations, and present complex data in a clear and compelling way. This hands-on approach ensures you’re industry-ready and confident to work on real-world business problems and client projects.
Analytics and visualization experts are among the most in-demand professionals globally. By completing this course, you’ll position yourself for career opportunities in data analytics, digital marketing, business intelligence, and consulting. Whether you’re a student, freelancer, or professional, these skills can help you command higher salaries, attract more clients, or grow your own business. With mentorship and certification, you’ll be ready to thrive in the data-driven future.
Have any questions? Contact our support team anytime for quick answers and expert course guidance.